Microphones are integral to capturing sound, whether for music, podcasts, or video production. But to choose the right microphone or optimize its use, understanding its technical aspects is essential. That’s where the microphone graph comes into play.
This blog explores everything about microphone graphs—from polar patterns and frequency response to practical tips for interpreting them. If you’ve ever wondered what those graphs on microphone specifications mean, this guide is for you.
What Is a Microphone Graph?
A microphone graph is a visual representation of a microphone’s performance characteristics. It shows how the microphone responds to sound across different frequencies and directions.
The two main types of microphone graphs are:
- Polar Patterns: These show how the microphone picks up sound from different directions.
- Frequency Response: These graphs display how a microphone responds to various frequencies.
Understanding these graphs helps in choosing the right microphone for specific applications.
Polar Patterns: The Directionality of Microphones
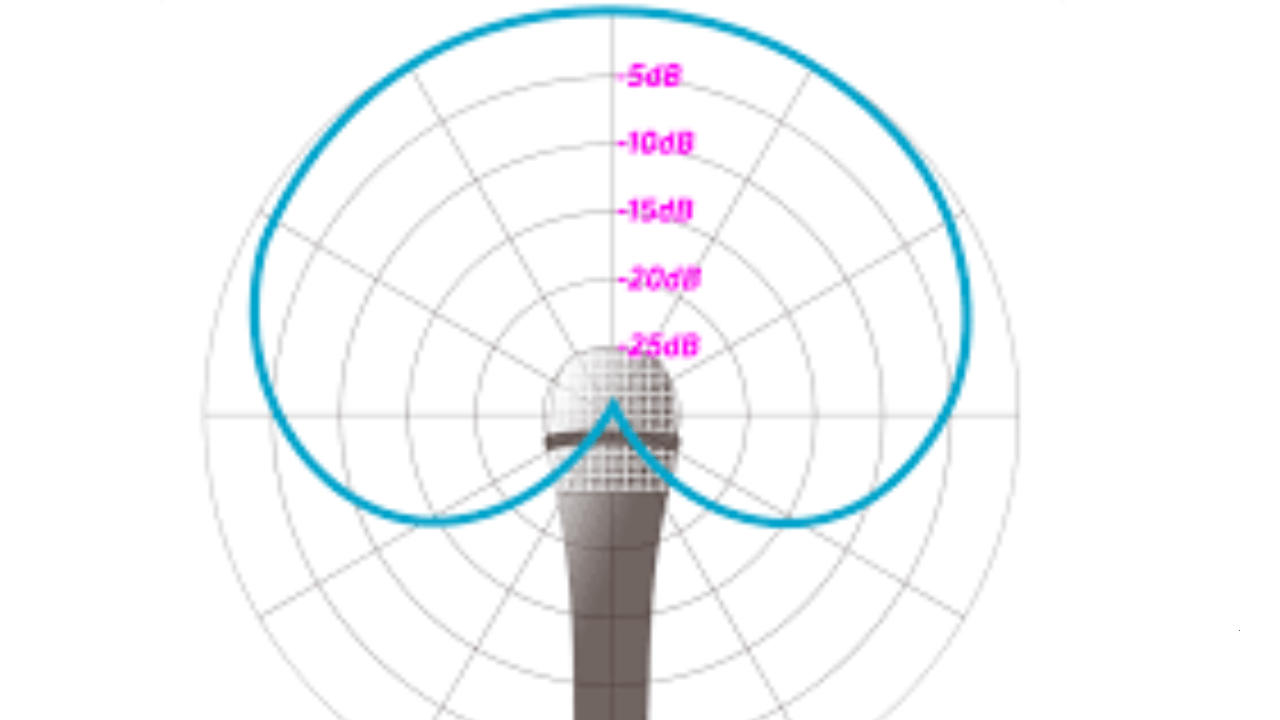
Polar patterns in a microphone graph represent the directional sensitivity of a microphone. This determines how well a microphone captures sound from various angles.
Common Polar Patterns
- Cardioid
- Captures sound primarily from the front.
- Ideal for vocals and instruments.
- Reduces background noise from the sides and rear.
- Omnidirectional
- Picks up sound equally from all directions.
- Great for recording ambient sounds or group discussions.
- Figure-8 (Bidirectional)
- Sensitive to sound from the front and back.
- Used in stereo recording techniques.
- Supercardioid and Hypercardioid
- Offer narrower front sensitivity.
- Excellent for isolating sound in noisy environments.
Frequency Response: Capturing the Spectrum of Sound
A frequency response graph shows how a microphone reacts to different frequencies. The graph typically ranges from 20 Hz to 20,000 Hz, the limits of human hearing.
Key Terms in Frequency Response
- Flat Response
- Indicates consistent sensitivity across all frequencies.
- Ideal for studio recordings where accuracy is key.
- Boosts and Cuts
- Peaks and dips in the graph indicate boosted or attenuated frequencies.
- Vocal microphones often boost midrange frequencies for clarity.
- Roll-Off
- A gradual decrease in sensitivity at extreme low or high frequencies.
- Helps reduce unwanted noise like wind or hum.
Reading a Microphone Graph
Steps to Understand a Microphone Graph
- Identify the Type of Graph
- Polar pattern graphs show directionality.
- Frequency response graphs show tonal characteristics.
- Examine the Axes
- For frequency response, the horizontal axis shows frequency, and the vertical axis shows sensitivity.
- For polar patterns, the graph is circular, indicating directionality.
- Match Graph Features to Application
- A flat frequency response is ideal for neutral sound.
- Cardioid polar patterns suit vocal recording due to their focused sensitivity.
Applications of Microphone Graphs
1. Music Production
Understanding microphone graphs helps in selecting the right microphone for vocals, instruments, or ambient sounds.
2. Live Sound
Polar patterns guide microphone placement to reduce feedback and capture the desired sound source.
3. Broadcasting and Podcasts
Frequency response graphs ensure that the microphone captures clear and intelligible voice recordings.
4. Field Recording
Omnidirectional polar patterns and flat frequency responses are useful for capturing natural ambient sounds.
Examples of Popular Microphones and Their Graphs
Shure SM58 (Dynamic Microphone)
- Polar Pattern: Cardioid.
- Frequency Response: Boosted midrange for vocal clarity.
Audio-Technica AT2020 (Condenser Microphone)
- Polar Pattern: Cardioid.
- Frequency Response: Flat with slight high-frequency boost for detailed sound.
Rode NT1 (Studio Condenser)
- Polar Pattern: Cardioid.
- Frequency Response: Extremely flat for accurate sound reproduction.
How to Choose a Microphone Using Graphs
Step 1: Define Your Purpose
- Vocal recordings? Look for a cardioid pattern with a midrange boost.
- Instrument recordings? A flat frequency response works best.
Step 2: Compare Graphs
Study graphs from different microphones to find one that matches your needs.
Step 3: Test in Real-Life Scenarios
Even the best microphone graph doesn’t replace hands-on testing in your recording environment.
Optimizing Your Microphone Placement Using Graphs
1. Polar Pattern Considerations
- Place cardioid microphones facing the sound source to maximize capture.
- Use figure-8 microphones for stereo recordings.
2. Frequency Response Adaptation
- Adjust equalization (EQ) settings to complement the microphone’s frequency response.
Future of Microphone Graphs
As technology evolves, microphone graphs are becoming more detailed, incorporating 3D representations and real-time analysis. These advancements will provide deeper insights, making it even easier to select the perfect microphone for any application.
Conclusion
Understanding the microphone graph is crucial for making informed decisions in audio production. Whether you’re a musician, podcaster, or audio engineer, these graphs provide valuable insights into microphone performance.
By mastering polar patterns and frequency responses, you can elevate the quality of your recordings and achieve the sound you’ve always wanted.
Related Articles:
For further reading, explore these related articles:
- Best Microphone for Singing at Home: Easy Guide for Beginners
- Best Microphone for Vocals – Top Picks for Studio and Live Performances
For additional resources on music marketing and distribution, visit Deliver My Tune.


